1. First, open DevTools on the webpage where you want to capture the popup.
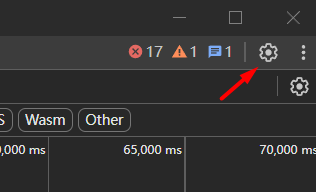
2. Click on Settings.
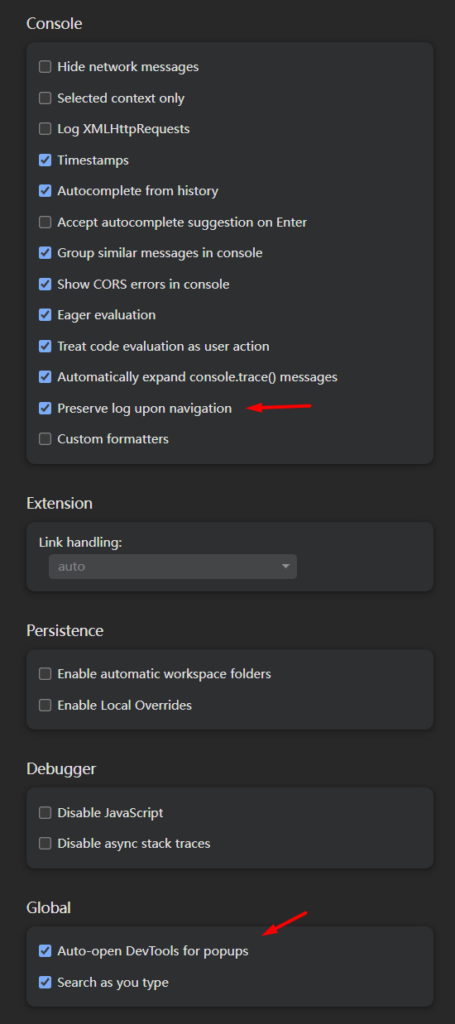
3. Enable “Global → Auto-open DevTools for popups” and “Console → Preserve log upon navigation”.
4. Next, click the popup button to trigger the popup. DevTools should automatically open for the popup at the same time.
5. In the newly opened DevTools for the popup, go to “Sources”, then under “Event Listener Breakpoints,” check “Window.”
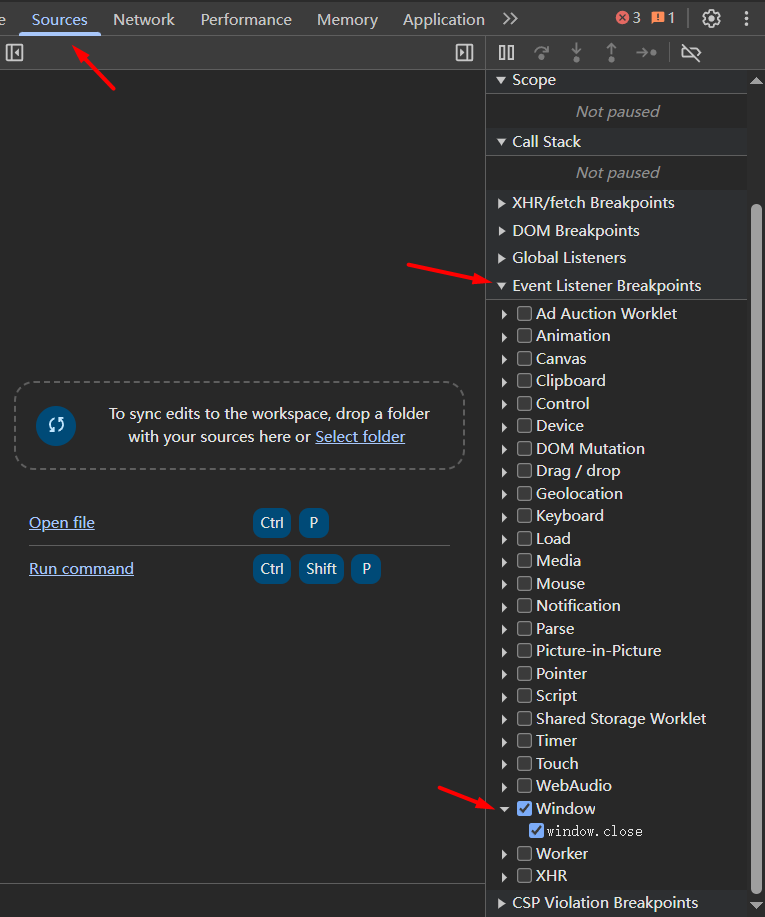
6. Now, return to the popup and do whatever you need. When the popup tries to close itself with window.close(), it will trigger the debugger to pause, giving you time to go back to the Network tab and export the HAR file.